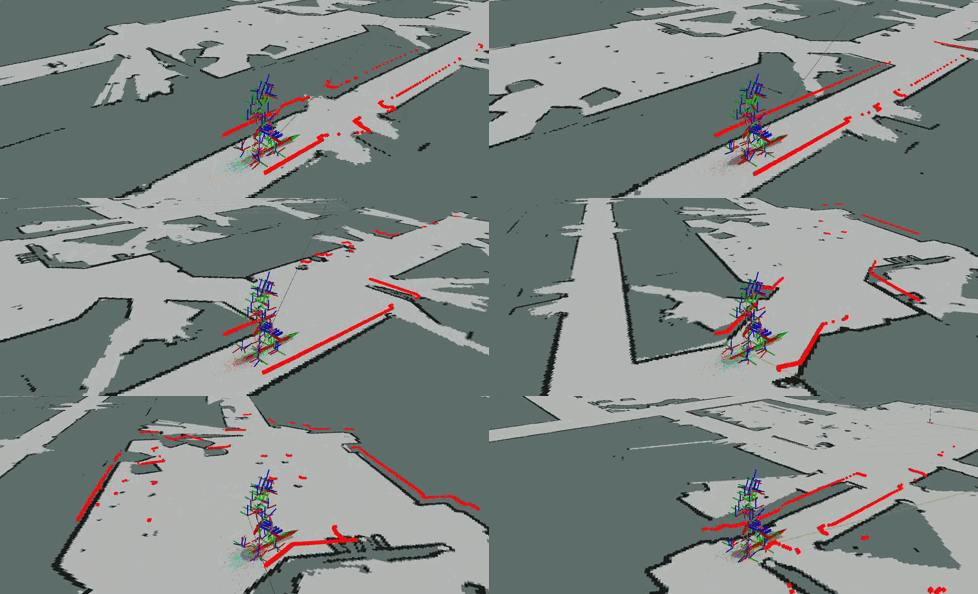
What is Beluga?
If you have been following us lately, or if you attended our recent ROSCon 2024 talk at Odense, you might have already heard about Beluga and Beluga AMCL, and you can skip the rest of this section.
Beluga is a header-only C++ library of reusable components that can be used to implement localization particle filters such as those used in robotics. Beluga AMCL is a feature-by-feature re-implemention of the existing Nav2 AMCL package in ROS, but using the Beluga library as the underlying engine. The goal of Beluga AMCL package is to provide a smooth transition path for current users of Nav2 into a more modern, efficient, and maintainable localization alternative based on the Beluga library.
Why benchmarking Beluga AMCL?
The AMCL package in ROS has been widely used in countless projects over the years. It is a very mature piece of code and it has proven to be a reliable too for roboticists all over.
Beluga AMCL, on the other hand, is relatively new. While the project enjoys extensive test coverage, that’s no substitute for real-world performance evaluations and user feedback, and so we launched a benchmarking campaign to evaluate the accuracy and resource usage of Beluga AMCL and to compare it against those of Nav2 AMCL.
Methodology
We aimed at evaluating both the accuracy and resource usage of Beluga AMCL while in use in representative real-world scenarios.
To establish a performance baseline, we also characterized the accuracy and resource usage of the Nav2 AMCL package, running in the same host and under the same conditions as Beluga AMCL.
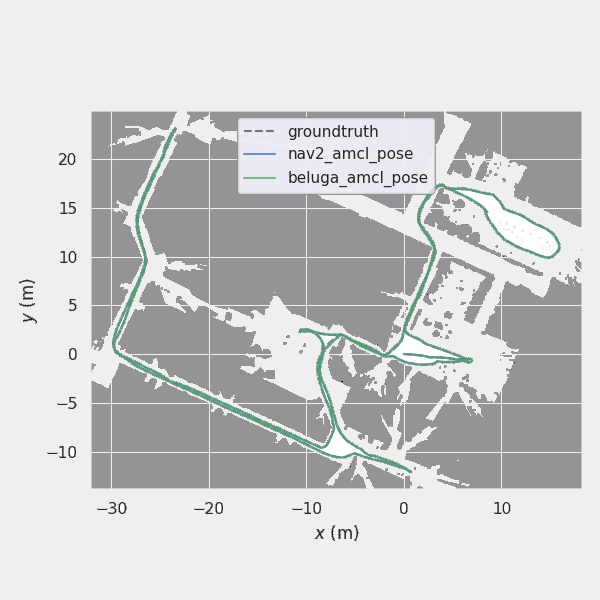
Accuracy is measured by processing the evo package. The metric used is the Absolute Pose Error (APE) with trajectory alignment (Umeyama’s method) and translational pose relation. This is equivalent to the ATE metric as defined in Prokhorov et. al. 2018.
The APE metric is calculated against the ground-truth trajectory of the robot, which is obtained from the dataset itself (see below). The APE metric is calculated for the entire trajectory, and the results are aggregated to obtain mean, median, standard deviation and maximum values.
For very short datasets (i.e. only a few seconds) the APE statistics are calculated across multiple independent iterations over the same dataset to improve statistical significance. Independence can be assumed because of the random nature of the particle filter algorithm; notice, however, that Nav2 AMCL may not be fully independent due to the use of a deterministic seed for the random number generator.
Resource usage is measured using the timemory toolkit’s timem command line tool as a wrapper around the benchmarked processes. For the purposes of this benchmark we collect data on the average CPU usage and Peak Resident Set Size (RSS) of the process.
For every benchmark the default value of all configuration parameters was used. The only exceptions to this were the sensor model and the motion model, which were set according to the nature of the dataset being used and the sensor model being evaluated.
To be able to carry out the benchmarking campaign in a repeatable and reproducible way, we used a tool we have been working on for a few years now called LAMBKIN. LAMBKIN is a benchmarking tool that allows you to run a set of benchmarking experiments in a controlled way, and to collect and analyze the results in an optional output report.
Datasets
The data used for benchmarking comes from a number of publicly available datasets. These datasets were chosen to represent a variety of real-world scenarios, such as offices, warehouses, and such, and different types of drives and sensors.

For this benchmarking campaign, we chose the following datasets:
- Willow Garage dataset: This is a very large dataset generated using an omnidirectional PR2 robot, wandering around a large office space. The dataset consists of 67 separate bagfiles, totaling about 18 hours of recorded data.
- Toronto Warehouse Incremental Change SLAM (TorWIC SLAM) dataset: This dataset was gathered using a differential drive robot in a Clearpath Robotics facility. The data includes multiple days of operation, and multiple runs each day, with the warehouse undergoing incremental changes in between.
- Toronto Warehouse Incremental Change Mapping (Torwic Mapping) dataset: This dataset was gathered using a differential drive robot in a synthetic warehouse environment where the arrangement of the warehouse around the robot undergoes controlled changes between different runs compared to an initial baseline.
- Magazino dataset: A small dataset gathered using a Magazino Toru robot moving along a long hallway, back and forth.
- Openloris Office: A small dataset gatherer using a diff-drive robot moving around a small office space.
None of these datasets were intended to be used for MCL evaluation purposes, and thus required some pre-processing before first use. Differences in formats (incl. ROS version mismatches) had to be ironed out, and recording issues had to be addressed.
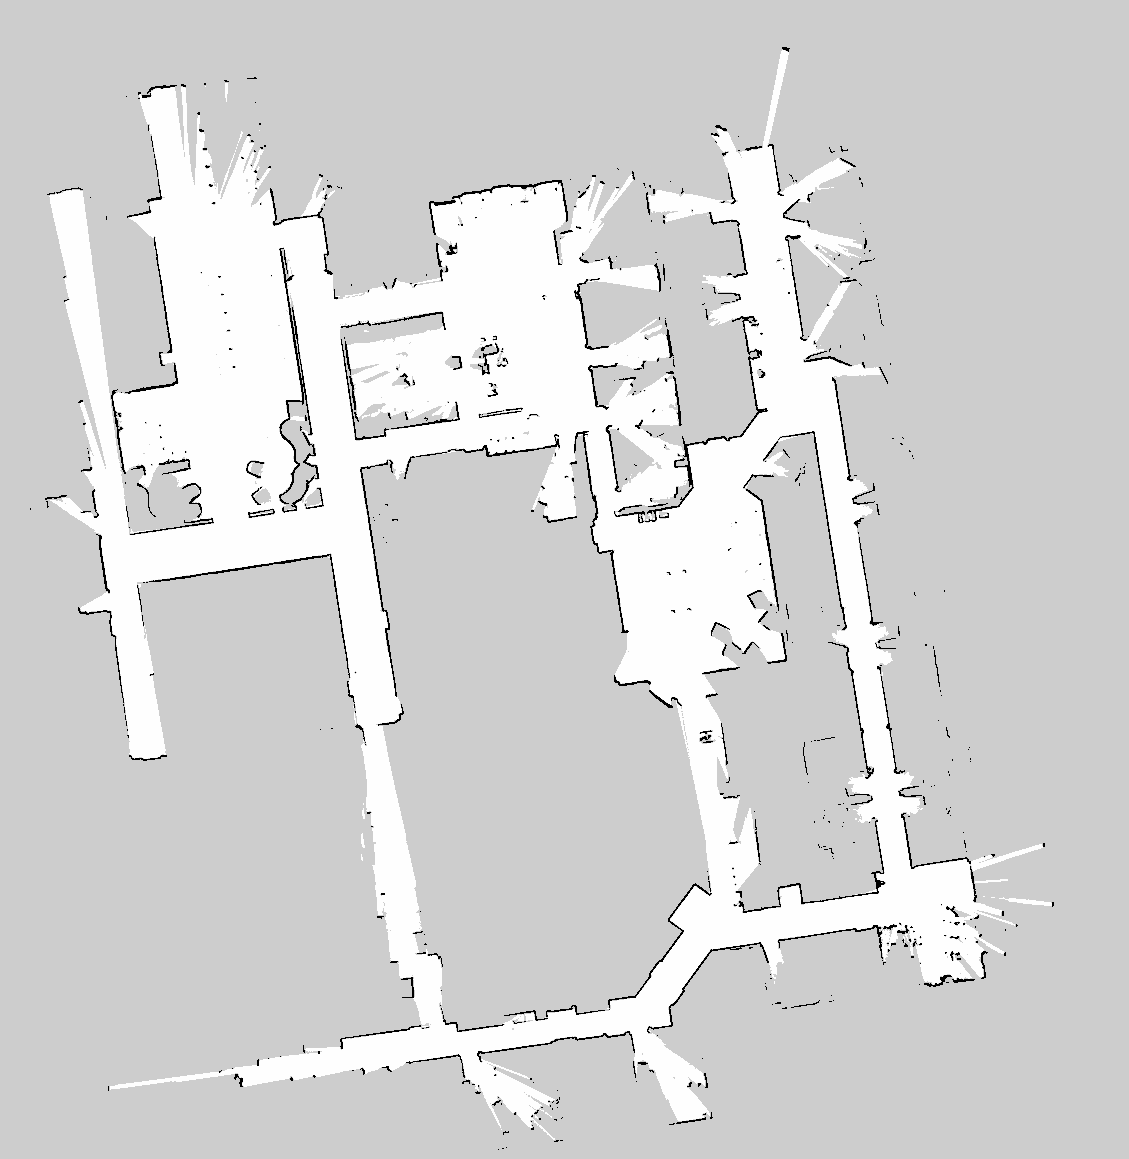
In particular, none of the datasets provided occupancy maps with their matching ground-truth trajectories. A few provided one or the other, but not both. To get around this we generated both the map and the trajectory from a single source by running Cartographer against each bag file and processing the resulting pbstream file.

Given that the longest bag in these real-world datasets is a little over 30 minutes long, we also created a synthetic dataset by recording a 24 hour long bag file for an omnidirectional robot wandering around a environment simulated in Gazebo Sim (based on the AWS Robomaker Gazebo World). This dataset was used to characterize long-term performance of both Beluga AMCL and Nav2 AMCL, with an eye towards evaluating the impact of memory usage over time and detecting potential memory leaks.
Results
We uploaded the output report of the benchmarking process here: Beluga AMCL Benchmarking Report. Additional raw output data (evo plots, timemory summaries, etc) can be found in this supplementary file.
In total, we processed 95 bag files across 5 different datasets, evaluating two model sensors in each case (beam and likelihood sensor). This amounts to approximately 90 hours of total execution time.
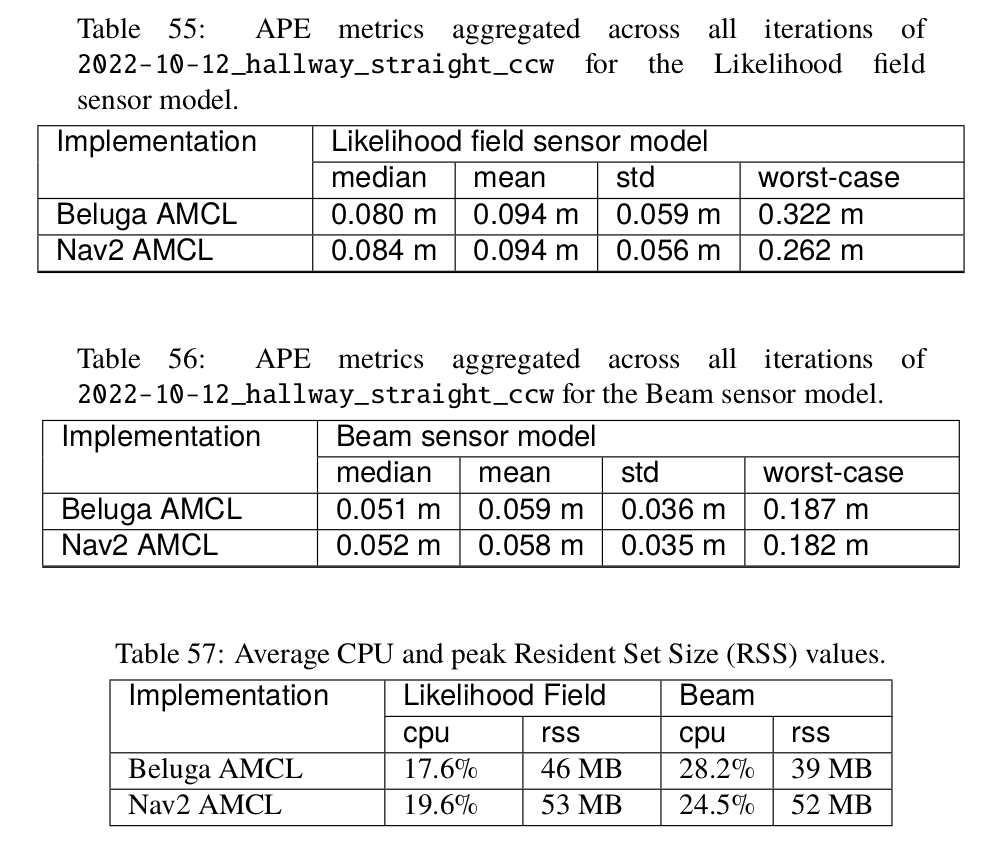
The results demonstrate that Beluga AMCL is able to perform at a level comparable to Nav2 AMCL in terms of accuracy and resource usage.
Absolute Pose Error (APE) metrics for both packages show no statistically significant differences — all differences well within a standard deviation.

CPU usage is similar between both packages too, with a slight advantage for Beluga AMCL when using the likelihood sensor model, and a slight advantage for Nav2 AMCL when using the beam model. Differences are small, though, with most experiments averaging between 10% and 20% CPU usage depending on the sensor model and the dataset.
There’s a visible advantage in favor of Beluga AMCL when it comes to memory usage, with Beluga AMCL showing generally lower peak RSS values. This is particularly noticeable when using the beam sensor model. This can be attributed to the fact that Nav2 AMCL allocates memory for a likelihood field, unused in this sensor modality, whereas Beluga AMCL does not. This difference can be shown to grow proportionally to map area, and therefore can become significant for robots operating in large buildings.

In the case of the Willow dataset, two out of the sixty-seven bag files suffered from very high APE statistics both Beluga and Nav2, clearly indicating that at some point during execution the localization algorithms lost track of the robot’s pose and began drifting. This happened for the bag files named “2011-08-11-14-27-41” and “2011-09-02-09-20-25”.
Upon analysis, in both cases the problem was shown to be due to errors in the occupancy-grid map and ground-truth trajectory generated using SLAM during dataset pre-processing. Future re-evaluations of this benchmark may be able to correct this issue by further customizing the SLAM parameters.
What’s next?
Our benchmarking campaign showed that Beluga AMCL is a viable alternative to Nav2 AMCL, with comparable accuracy and resource usage. This is a significant milestone for the Beluga project, and we are very happy with the results.
We are not stopping here, though. We are currently evaluating a number of potential improvements and new features. We intend to follow an evidence-based approach for this, by first proving that there’s a measurable advantage in implementing these features. This requires further benchmarking, which we are currently working on.
We are also interested in expanding the benchmarking data with datasets for environments that are not well represented in the current set, such as large-scale indoor environments, environments with long and narrow aisles, and others. Unfortunately, datasets for these environments are not as readily available as the ones we used for this campaign, so we are currently exploring alternatives. If you happen to have real-world data of this sort that you can share with us, please contact us!
Try it out!
As usual, you’re invited to try Beluga and Beluga AMCL! Check out the GitHub repository. You can also visit the project’s documentation site. Would you like to go deeper? Get started with the Beluga library by following the tutorials. We are always looking for feedback, so don’t hesitate to open an issue or a pull request if you find something that can be improved.
Contact us
If you have any questions or comments, feel free to reach out to us with your thoughts.